Outer Island Pier Water Quality (2013)
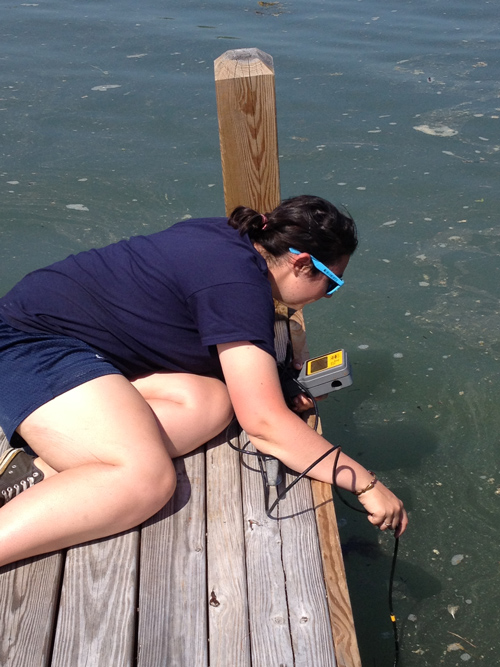 Water quality parameters were monitored by the CSU interns during the Summer 2013 from May 31st to August 6th. Water quality monitoring occurred each day at 2:00 pm from the end of the floating dock. Water quality parameters monitored included: water temperature, salinity, conductivity, specific conductance, dissolved oxygen, Secchi disk depth, turbidity, and pH. All measurements were made on water samples collected from at a depth of one meter.
Salinity ranged from a low of 24.3 ppt (7/20) to a high of 28.6 ppt (8/5) with a mean value of 26.6 ppt (Figure 1a). Water temperature varied from a low of 16.7°C on May 31st and increased to the maximum temperature of 25.3°C on July 18th (Figure 1b). Water temperature gradually increased from the spring to the end of the summer. Dissolved oxygen concentrations were highest initially (8.4 mg/L) and gradually decreased to a low of 4.05 mg/L on August 5th (Figure 1b). Water temperature and dissolved oxygen concentrations are inversely related, with oxygen solubility decreasing in warmer water.
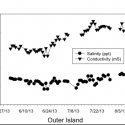
Figure 1a
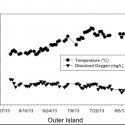
Figure 1b
Water clarity, as measured by a Secchi disk, varied from 0.75 m (5/31) to 1.5 m (7/14) during the monitoring period (Figure 2a). Greater variability was measured in water turbidity, where values ranged from 1.17 NTU (6/1) to 6.00 NTU (6/14) (Figure 2a). In general, as turbidity increases water clarity, as measured by the Secchi disk should decrease. pH ranged from a low of 8.01 (5/31) to a high of 8.93 (7/24) (Figure 2b).
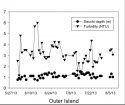
Figure 2a
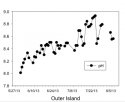
Figure 2b
View/Download Data (Adobe PDF | Microsoft Excel)
2013| 2014| 2015| 2016| 2017| 2018| 2019| 2020 | 2021 | 2022 | 2023 | 2024