Outer Island Pier Water Quality (2016)
Water quality parameters were monitored by the CSU interns during the Summer 2016 from June 26th to August 15th. Water quality monitoring occurred each day at 2:00 pm from the end of the floating dock. Water quality parameters monitored included: water temperature, salinity, conductivity, specific conductance, dissolved oxygen, Secchi disk depth, and pH. All measurements were made on water samples collected from at a depth of one meter.
Salinity showed little variability, with a range of 27.5 ppt (6/27) to 28.7 ppt (7/31), while conductivity showed a slightly larger range from 41.38 mS (7/14) to 44.38 mS (7/31) (Figure 1a). Water temperature gradually increased from the spring to the end of the summer (Figure 1b). Water temperature increased from 20.3ºC (6/28) to 25.8ºC (8/15). Dissolved oxygen concentrations gradually decreased as temperatures increased with a low of 5.94 mg/L on 8/15. Temperature and dissolved oxygen varied inversely (Figure 1a).


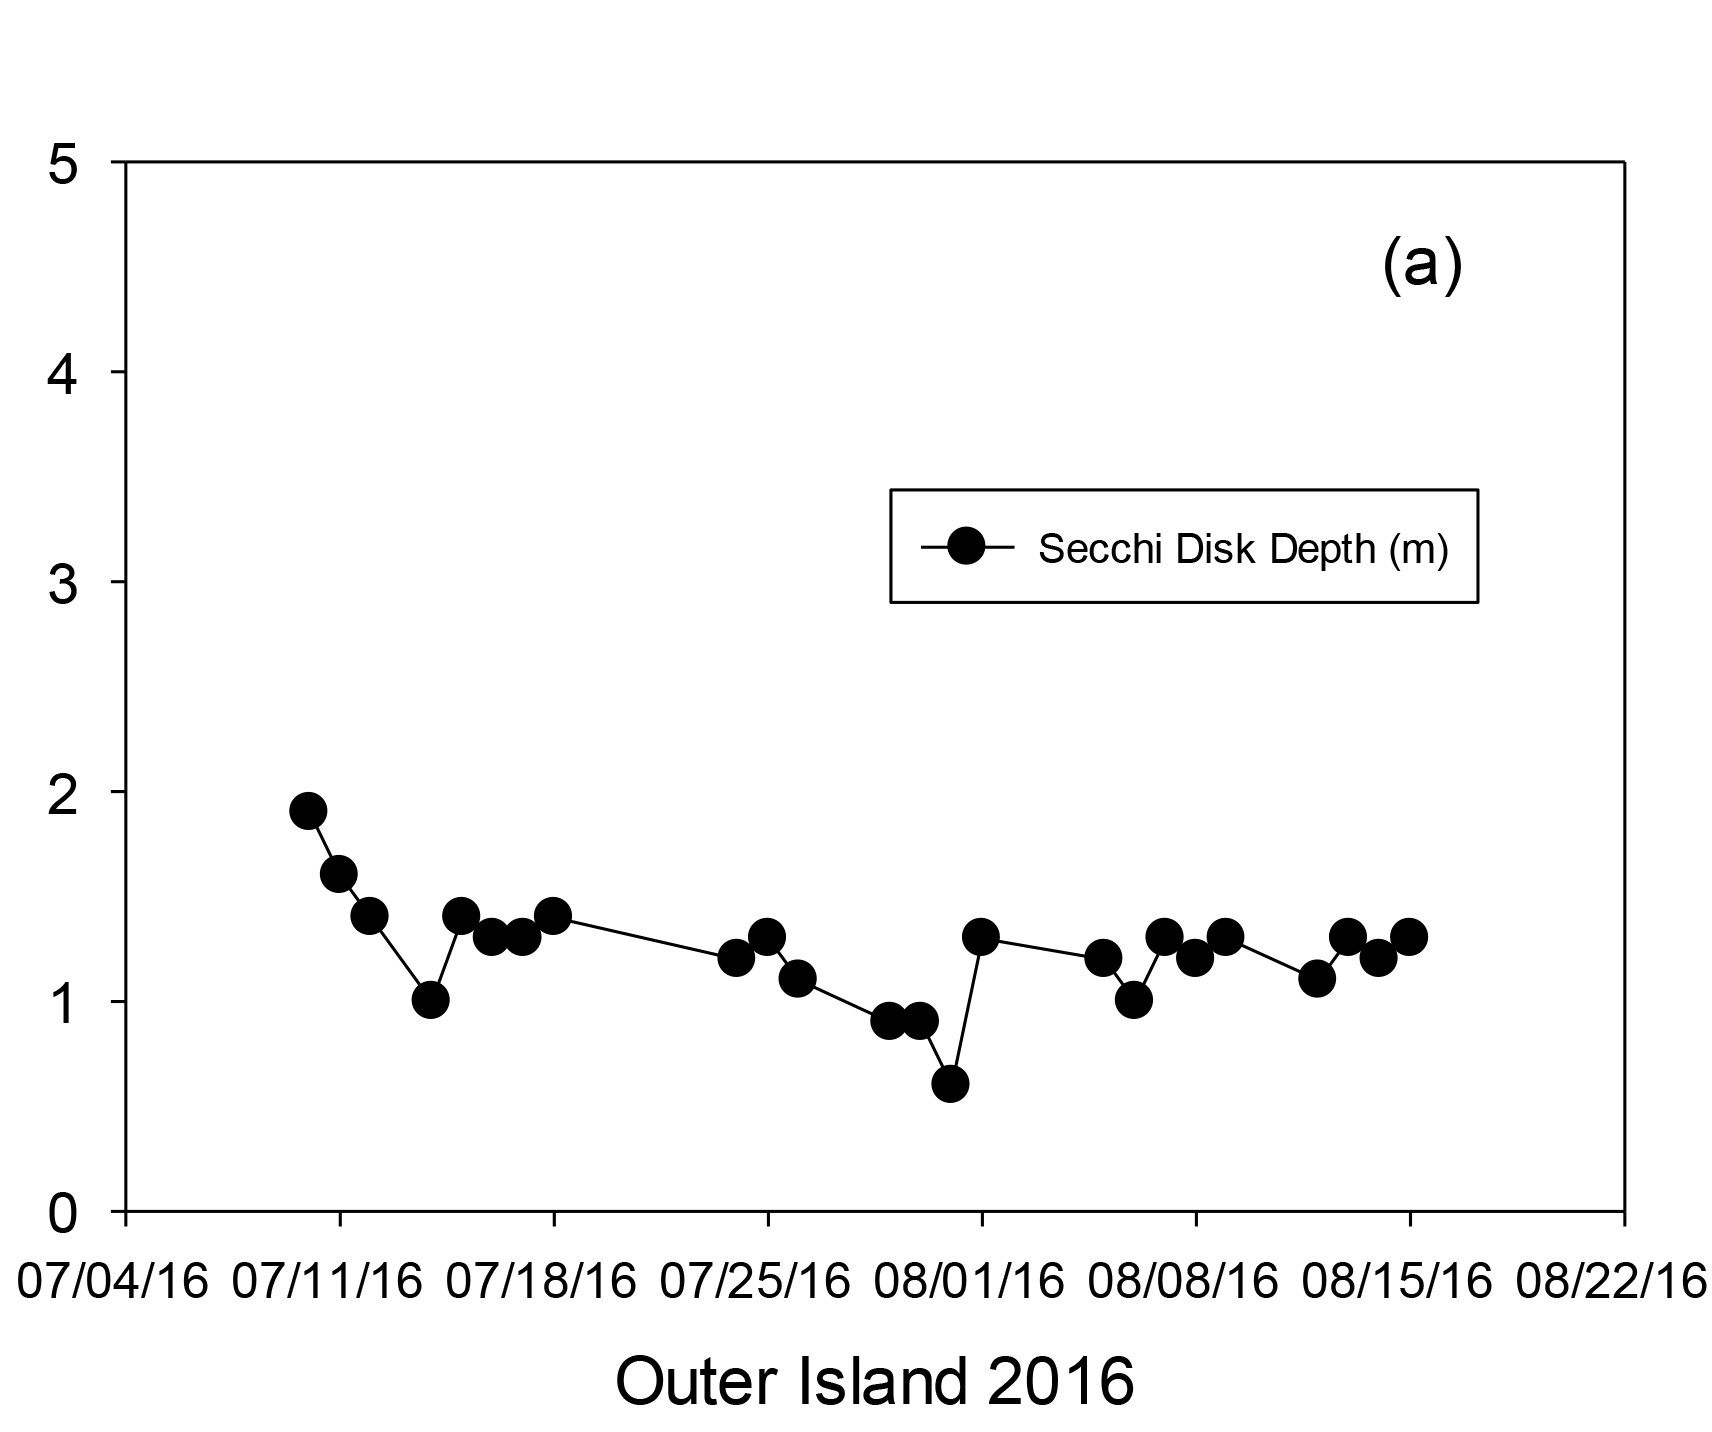
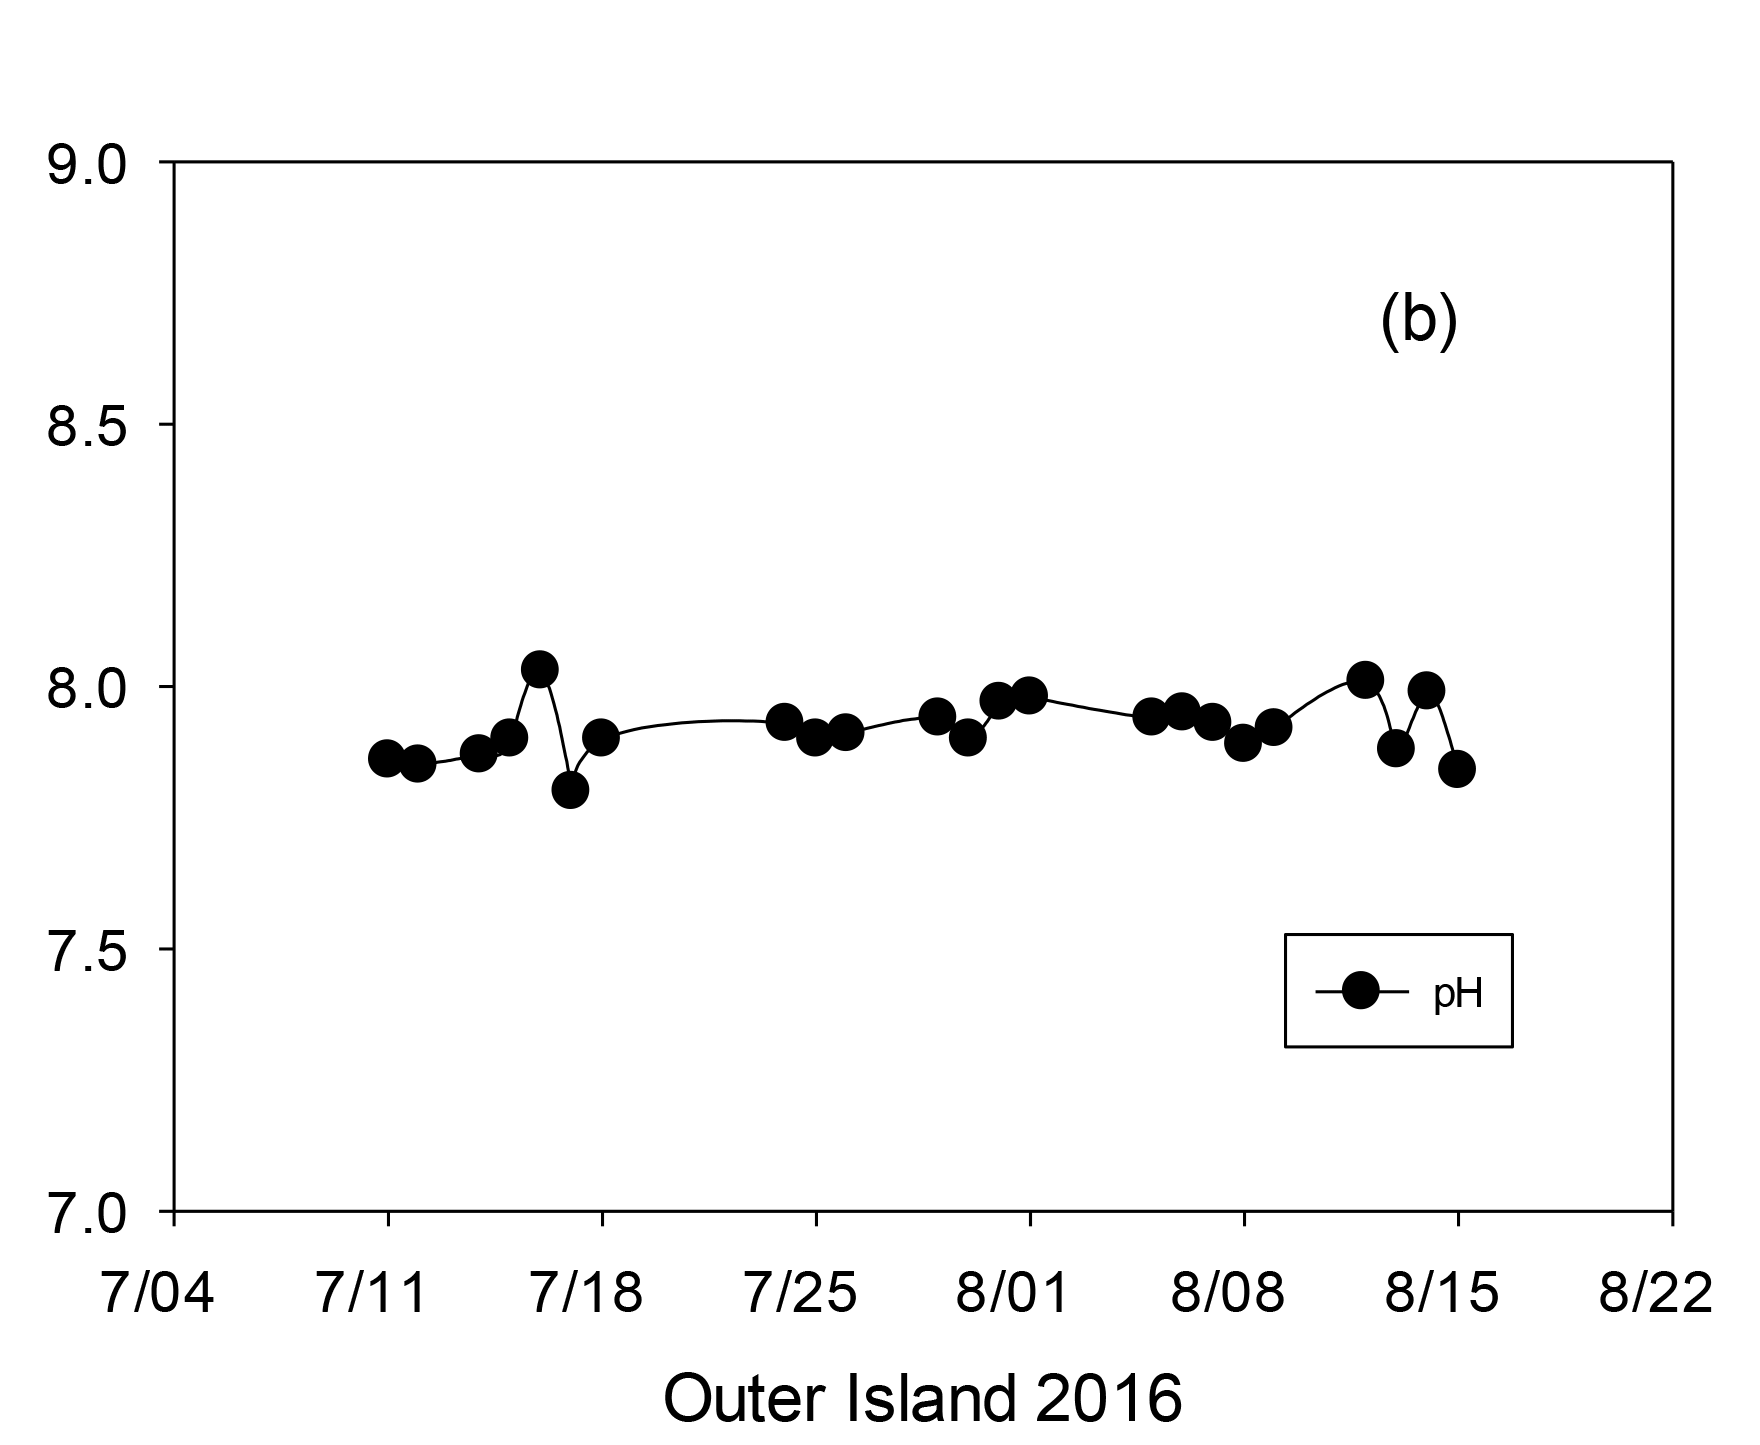
Water clarity, as measured by a Secchi disk, varied from 0.60 m (7/31) to 1.9 m (7/10) during the monitoring period (Figure 2a). pH ranged from a low of 7.84 (8/15) to a high of 8.03 (7/16) (Figure 2b).
View/Download Data (Adobe PDF | Microsoft Excel)
2013| 2014| 2015| 2016| 2017| 2018| 2019 | 2020 | 2021 | 2022 | 2023 | 2024